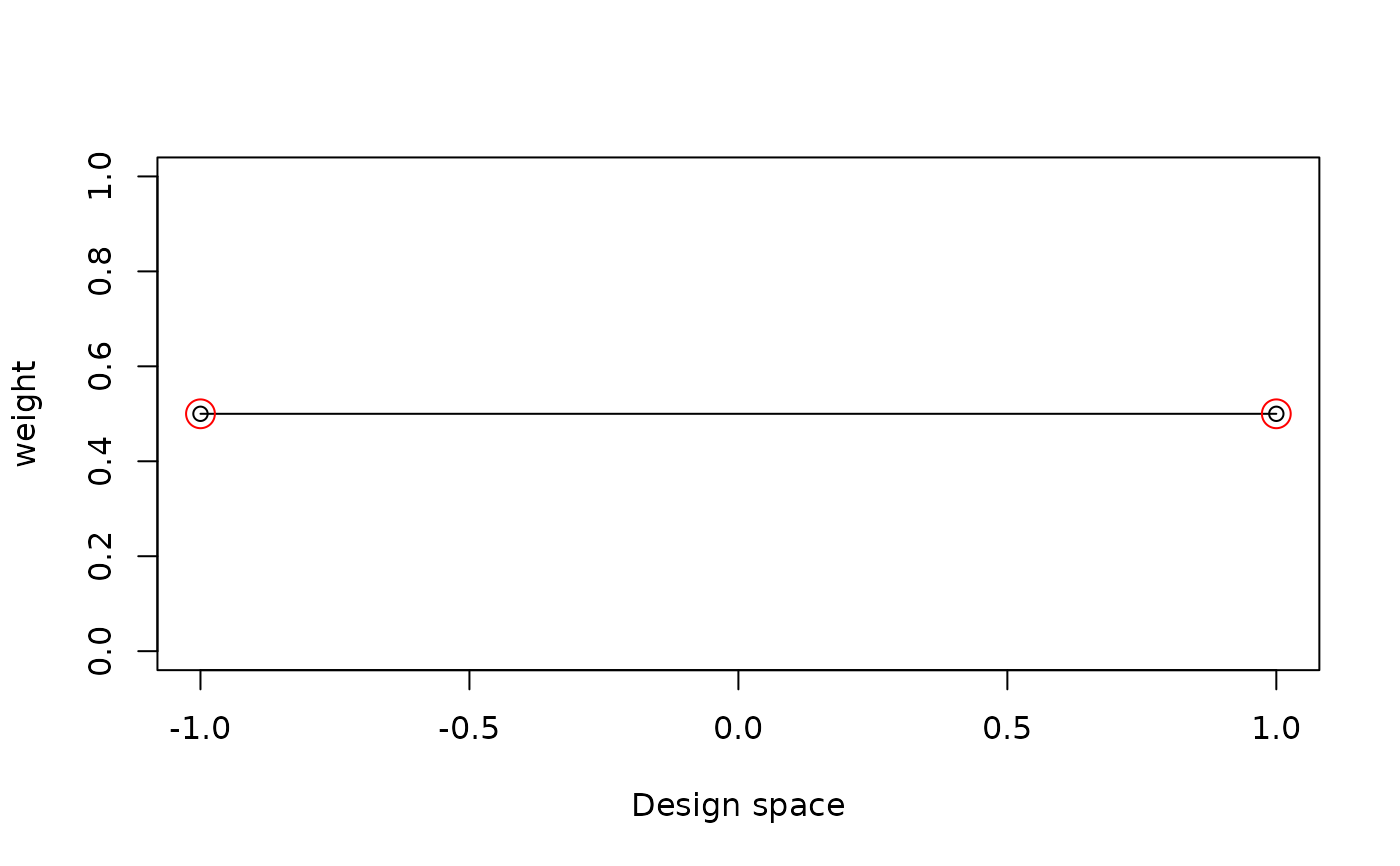
Plot the weight distribution of the optimal design for univaraite regression model
Source:R/plot_weight.R
plot_weight.RdPlot the weight distribution of the optimal design for univaraite regression model
R/plot_weight.R
plot_weight.RdPlot the weight distribution of the optimal design for univaraite regression model