Contrasts and Estimable Comparisons
A scientific question often concerns a difference between means rather than one coefficient printed by software. This optional reading uses the linear-combination inference from Chapter 3 — Distribution Theory of OLS and Inference to express those questions. The experimental-design unit connects these comparisons to the design that generated the observations.
Learning objectives. Express a comparison as a linear function of regression coefficients, obtain its estimate and interval, interpret a conditional comparison, and distinguish one comparison from a family of comparisons.
NoteOptional reading after Chapter 5
The main sequence now develops transformations and variable selection in Chapter 7. This reading preserves the dose-specific ToothGrowth comparisons, individual and simultaneous intervals, and additional contrast practice. Use it when a scientific question requires a specified difference between means.
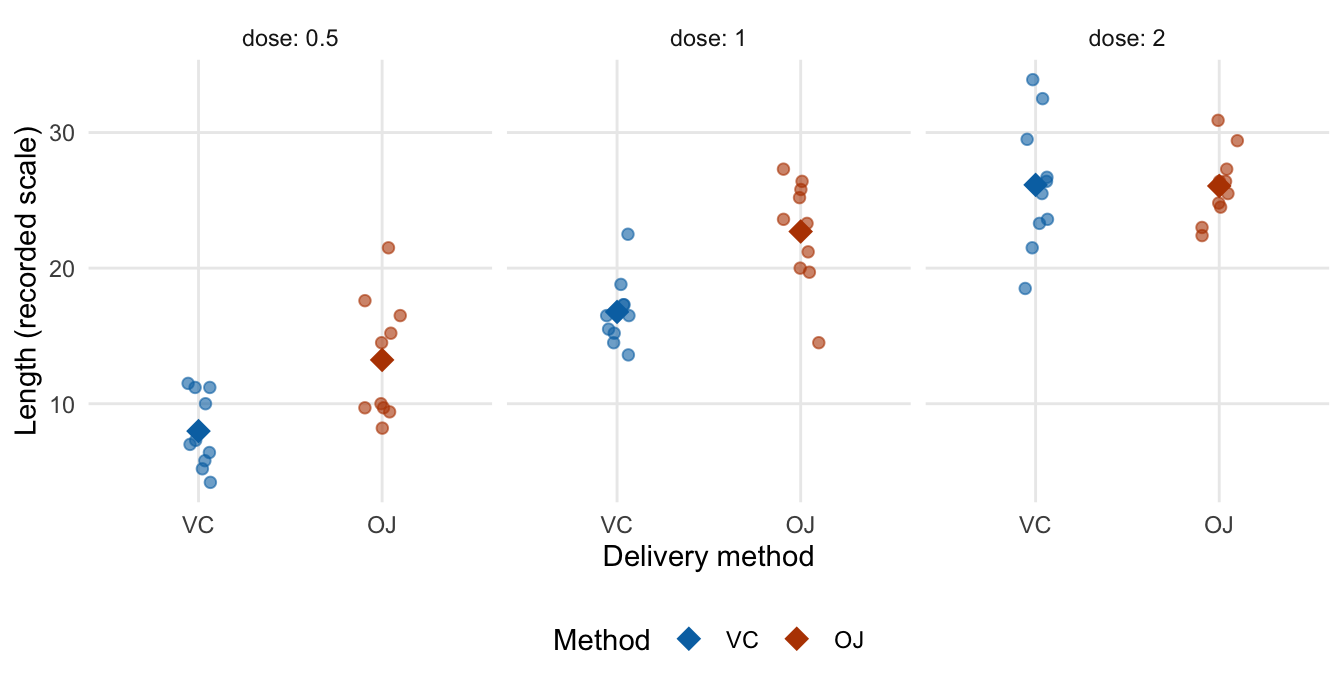
Application: does the method difference depend on dose? The plot continues Chapter 5. Compare OJ with VC separately at each observed dose before deciding which quantity to estimate. The ToothGrowth documentation describes 60 guinea pigs, two delivery methods and three doses in mg/day; the response is recorded odontoblast length.
Comparisons of group means
Suppose the conditional means of three groups are \(\mu_A\), \(\mu_B\), and \(\mu_C\). A question such as “Does A differ from the average of B and C?” concerns \(\theta=\mu_A-(\mu_B+\mu_C)/2\).
Definition 1 (Contrast of Group Means) A contrast is a linear combination \(\theta=\sum_{j=1}^g c_j\mu_j\) whose weights satisfy \(\sum_{j=1}^g c_j=0\). The zero-sum condition makes the comparison unchanged when the same constant is added to every group mean.
From means to coefficients. With A as the reference group, write \(\boldsymbol{\beta}=(\beta_0,\beta_B,\beta_C)\). Then \(\mu_A=\beta_0\), \(\mu_B=\beta_0+\beta_B\), and \(\mu_C=\beta_0+\beta_C\), so
\[ \theta=-\tfrac12\beta_B-\tfrac12\beta_C =\mathbf{a}^\top\boldsymbol{\beta},\qquad \mathbf{a}=(0,-\tfrac12,-\tfrac12). \]
ImportantThe zero-sum condition applies to mean weights
The weights on \((\mu_A,\mu_B,\mu_C)\) sum to zero. The equivalent weights on treatment-coded regression coefficients need not sum to zero. Always translate the scientific comparison through the chosen parameterization.
Under the full-rank normal linear model, use
\[ \hat\theta=\mathbf{a}^\top\hat{\boldsymbol{\beta}},\qquad \operatorname{SE}(\hat\theta)=\hat\sigma \sqrt{\mathbf{a}^\top(\mathbf{X}^\top\mathbf{X})^{-1}\mathbf{a}}. \]
A confidence interval is \(\hat\theta\pm t_{1-\alpha/2,n-p}\operatorname{SE}(\hat\theta)\). This is the same procedure as in Chapter 3 — Distribution Theory of OLS and Inference, applied to a different target. For one fixed restriction under the same fitted normal model, the corresponding F statistic equals the squared t statistic. Several linearly independent restrictions can be collected into \(\mathbf C\boldsymbol\beta=\mathbf d\), with \(\operatorname{rank}(\mathbf C)=r\), and tested jointly using the general F test.
Interpretation. Report the contrast estimate in the units of the response, its interval, and which population means it compares. Equality of two slopes is only a meaningful scientific question when their units and scales make that comparison defensible.
Conditional comparisons in the ToothGrowth data
Chapter 5 compared two straight lines with a model for all six method-dose means. The straight-line restriction did not fit these data well. We therefore use the six-cell model for the comparisons below. The target at an observed dose \(d\) is
\[ \Delta_d=\mu_{\mathrm{OJ},d}-\mu_{\mathrm{VC},d}, \qquad d\in\{0.5,1,2\}. \]
Each dose defines a different comparison. Combining all doses into one average would require specifying the averaging weights and would answer another question.
Show R code
ch6_dat <- datasets::ToothGrowth
ch6_dat$supp <- factor(ch6_dat$supp, levels = c("VC", "OJ"))
ch6_dat$dose_f <- factor(ch6_dat$dose, levels = c(0.5, 1, 2))
ch6_fit <- lm(len ~ dose_f * supp, data = ch6_dat)
ch6_profiles <- expand.grid(dose_f = levels(ch6_dat$dose_f),
                            supp = levels(ch6_dat$supp))
ch6_X <- model.matrix(delete.response(terms(ch6_fit)),
                     data = ch6_profiles, contrasts.arg = ch6_fit$contrasts,
                     xlev = ch6_fit$xlevels)
# First three rows are VC; last three are OJ, in the same dose order.
ch6_L <- ch6_X[4:6, , drop = FALSE] - ch6_X[1:3, , drop = FALSE]
ch6_est <- drop(ch6_L %*% coef(ch6_fit))
ch6_V <- ch6_L %*% vcov(ch6_fit) %*% t(ch6_L)
ch6_se <- sqrt(diag(ch6_V))
ch6_df <- df.residual(ch6_fit)
ch6_crit <- qt(0.975, ch6_df)
ch6_results <- data.frame(
  Dose = levels(ch6_dat$dose_f), Estimate = ch6_est, SE = ch6_se,
  Lower = ch6_est - ch6_crit * ch6_se,
  Upper = ch6_est + ch6_crit * ch6_se,
  p_value = 2 * pt(-abs(ch6_est / ch6_se), df = ch6_df))
knitr::kable(ch6_results, digits = 3, row.names = FALSE,
caption = "OJ minus VC at each dose; individual 95% intervals.")| Dose | Estimate | SE | Lower | Upper | p_value |
|---|---|---|---|---|---|
| 0.5 | 5.25 | 1.624 | 1.994 | 8.506 | 0.002 |
| 1 | 5.93 | 1.624 | 2.674 | 9.186 | 0.001 |
| 2 | -0.08 | 1.624 | -3.336 | 3.176 | 0.961 |
Show R code
stopifnot(ch6_df == 54, max(abs(ch6_est - c(5.25, 5.93, -0.08))) < 1e-10)Where do the weights come from? A fitted mean at a predictor profile is a design row times \(\hat{\boldsymbol\beta}\). Subtract the VC row from the OJ row to obtain the weights for their difference:
\[ \hat\Delta_d=(\mathbf x_{\mathrm{OJ},d}-\mathbf x_{\mathrm{VC},d})^\top\hat{\boldsymbol\beta}, \qquad \widehat{\operatorname{Var}}(\hat\Delta_d) =\mathbf a_d^\top\widehat{\operatorname{Var}}(\hat{\boldsymbol\beta})\mathbf a_d. \]
The estimate is 5.25 at dose 0.5, 5.93 at dose 1, and \(-0.08\) at dose 2. The small last estimate does not establish equivalence; its interval describes uncertainty under the independent, common-variance normal model.
Do the two differences differ? Compare dose 1 with dose 2 using \(\theta=\Delta_1-\Delta_2\), rather than comparing their separate significance labels. Its estimate is \(5.93-(-0.08)=6.01\).
Show R code
ch6_a <- ch6_L[2, ] - ch6_L[3, ]
ch6_dd <- sum(ch6_a * coef(ch6_fit))
ch6_dd_se <- sqrt(drop(t(ch6_a) %*% vcov(ch6_fit) %*% ch6_a))
knitr::kable(data.frame(
  Comparison = "Difference at dose 1 minus difference at dose 2",
  Estimate = ch6_dd, SE = ch6_dd_se,
  Lower = ch6_dd - ch6_crit * ch6_dd_se,
  Upper = ch6_dd + ch6_crit * ch6_dd_se),
digits = 3, row.names = FALSE)| Comparison | Estimate | SE | Lower | Upper |
|---|---|---|---|---|
| Difference at dose 1 minus difference at dose 2 | 6.01 | 2.297 | 1.405 | 10.615 |
The same calculation works for a continuous-by-group model. For \(\Delta(x_0)=\beta_g+(x_0-1)\beta_{xg}\), the estimated variance is
\[ \widehat{\operatorname{Var}}(\hat\beta_g) +(x_0-1)^2\widehat{\operatorname{Var}}(\hat\beta_{xg}) +2(x_0-1)\widehat{\operatorname{Cov}}(\hat\beta_g,\hat\beta_{xg}). \]
Do not add coefficient standard errors, or omit their covariance. A separate significant/non-significant label for each estimate is not a test of their difference.
One comparison and a family of comparisons
For one prespecified comparison, the individual \(t\) interval answers the stated question. When reporting all three dose-specific OJ-minus-VC differences as a family, account for the three opportunities to make a false rejection. Prespecifying several tests does not remove this family-wise issue.
For this family of three tests, Holm adjusts the p-values. Bonferroni simultaneous intervals use critical value \(t_{1-\alpha/(2m),n-p}\) with \(m=3\); their joint coverage is at least \(1-\alpha\) under the model. These are two different adjustment procedures, so an adjusted p-value and an interval should be labeled with the procedure that produced it.
Show R code
ch6_m <- nrow(ch6_results)
ch6_bonf <- qt(1 - 0.05 / (2 * ch6_m), ch6_df)
knitr::kable(data.frame(
  Dose = ch6_results$Dose,
  Holm_p = p.adjust(ch6_results$p_value, method = "holm"),
  Bonferroni_lower = ch6_est - ch6_bonf * ch6_se,
  Bonferroni_upper = ch6_est + ch6_bonf * ch6_se),
digits = 3, row.names = FALSE)| Dose | Holm_p | Bonferroni_lower | Bonferroni_upper |
|---|---|---|---|
| 0.5 | 0.004 | 1.237 | 9.263 |
| 1 | 0.002 | 1.917 | 9.943 |
| 2 | 0.961 | -4.093 | 3.933 |
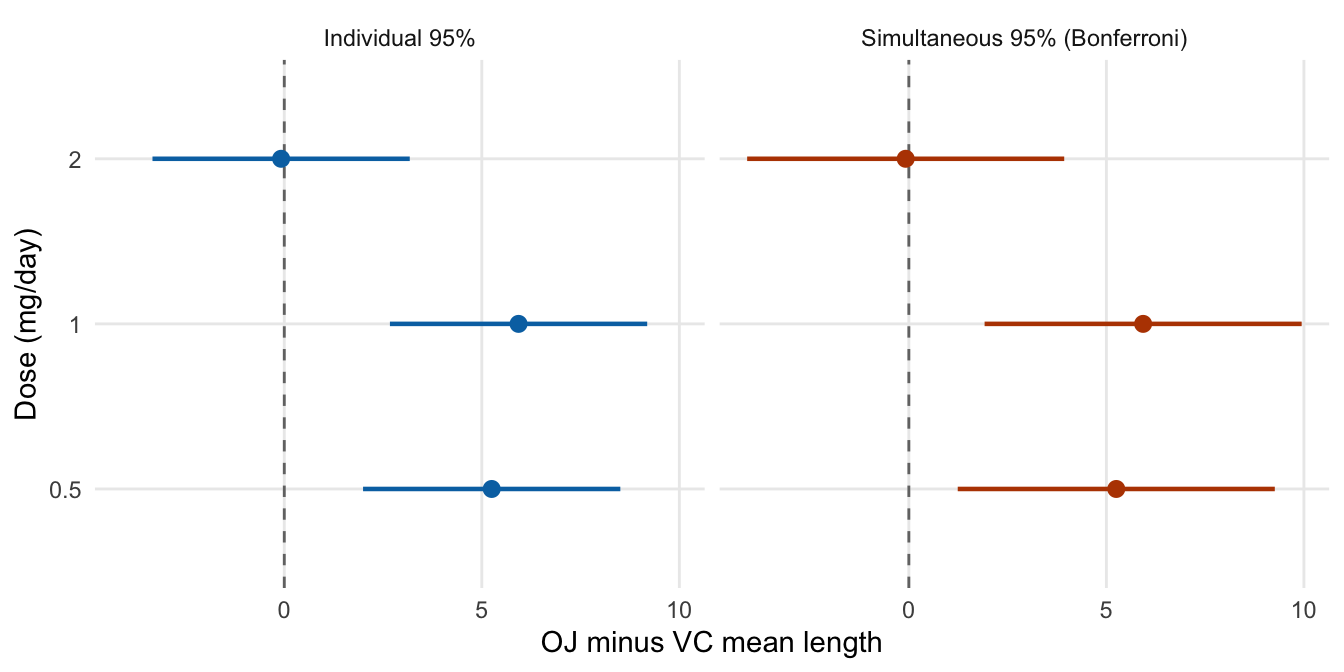
The difference-of-differences above is a separate teaching example. If it is also part of the reported inferential family, include it when defining that family and its adjustment. For all pairwise differences among levels of a simple one-way model, Tukey simultaneous intervals are another useful procedure. R documentation: Holm adjustment and Tukey intervals.
Exercise 1 (Check the Comparison)
- Write the mean weights for \(\Delta_1-\Delta_2\) in the order \((\mu_{\mathrm{VC},1},\mu_{\mathrm{OJ},1},\mu_{\mathrm{VC},2},\mu_{\mathrm{OJ},2})\).
- Does changing the reference method change the OJ-minus-VC target?
- Why are simultaneous intervals wider than individual intervals in the plot?
Solution 1.
- The weights are \((-1,1,1,-1)\); they sum to zero.
- No. Re-express the same target using the new coefficient coding; its estimate and SE remain the same.
- The simultaneous procedure protects the coverage of the whole stated family, rather than each interval separately.
Coding and estimability
Changing the reference group changes the coefficient labels and values, but not the fitted group means or a fixed comparison of those means. The vector \(\mathbf{a}\) must change with the coding so that it represents the same target.
Example 1 (An Intercept and All Group Indicators) In \(Y_{ij}=\mu+\tau_i+\varepsilon_{ij}\), adding a constant to every \(\tau_i\) and subtracting it from \(\mu\) leaves every group mean unchanged. The separate parameters are not identified without a constraint, but \(\tau_A-\tau_B\) is unchanged and is estimable.
The practical lesson is to state the target in terms of observable mean responses before reading coefficients. The row-space criterion and generalized-inverse formulation are beyond this reading.
Summary / Recap
- Start with the comparison of interest, then translate its mean weights into coefficient weights. A contrast of group means has weights summing to zero.
- Estimate \(\mathbf c^\top\boldsymbol\beta\) by \(\mathbf c^\top\hat{\boldsymbol\beta}\), with squared SE \(\mathbf c^\top\widehat{\operatorname{Var}}(\hat{\boldsymbol\beta})\mathbf c\). Include covariances.
- With an interaction, compare groups at specified predictor values. In ToothGrowth, the OJ-minus-VC comparison is estimated separately at each dose.
- A prespecified comparison and a family of comparisons have different error guarantees. State the family and distinguish individual from simultaneous intervals.
- Coding can change coefficients without changing an estimable comparison. One fixed restriction gives \(t^2=F\) under the same normal model.
The experimental-design unit asks which observations supply independent information for these comparisons.
Further practice: a three-group comparison
This simulated example separates the known data-generating means from their noisy estimates. Changing the seed changes the sample, not the target comparison.
Show R code
library(ggplot2)
theme_set(theme_minimal(base_size = 11) +
            theme(legend.position = "bottom",
              panel.grid.minor = element_blank()))

set.seed(8561)
group <- factor(rep(c("A", "B", "C"), each = 12))
mu <- c(A = 10, B = 13, C = 15)
dat <- data.frame(group,
                  y = unname(mu[group]) + rnorm(length(group), sd = 2))
fit <- lm(y ~ group, data = dat)

# A minus the average of B and C, under treatment coding.
a <- c(0, -1/2, -1/2)
estimate <- sum(a * coef(fit))
se <- sqrt(drop(t(a) %*% vcov(fit) %*% a))
df <- df.residual(fit)
ci <- estimate + c(-1, 1) * qt(0.975, df) * se
c(estimate = estimate, SE = se, lower = ci[1], upper = ci[2],
  p_value = 2 * pt(-abs(estimate / se), df))
estimate SE lower upper p_value
-3.3388312952 0.9030487544 -5.1760978004 -1.5015647901 0.0007874472 Verify the same question under another coding. A cell-means model directly estimates \((\mu_A,\mu_B,\mu_C)\), so its contrast weights are \((1,-1/2,-1/2)\).
Show R code
fit_means <- lm(y ~ 0 + group, data = dat)
c_mean <- c(1, -1/2, -1/2)
estimate_means <- sum(c_mean * coef(fit_means))
se_means <- sqrt(drop(t(c_mean) %*% vcov(fit_means) %*% c_mean))
rbind(treatment_coding = c(estimate, se),
      cell_means_coding = c(estimate_means, se_means))
[,1] [,2]
treatment_coding -3.338831 0.9030488
cell_means_coding -3.338831 0.9030488Show R code
contrast_result <- data.frame(estimate, lower = ci[1], upper = ci[2],
                               comparison = "A - (B + C) / 2")
ggplot(contrast_result, aes(estimate, comparison)) +
  geom_vline(xintercept = 0, linetype = "dashed", colour = "grey50") +
  geom_segment(aes(x = lower, xend = upper, yend = comparison),
               linewidth = 1, colour = "steelblue4") +
  geom_point(size = 3, colour = "steelblue4") +
  expand_limits(x = 0) +
  labs(x = "Estimated contrast and 95% confidence interval", y = NULL)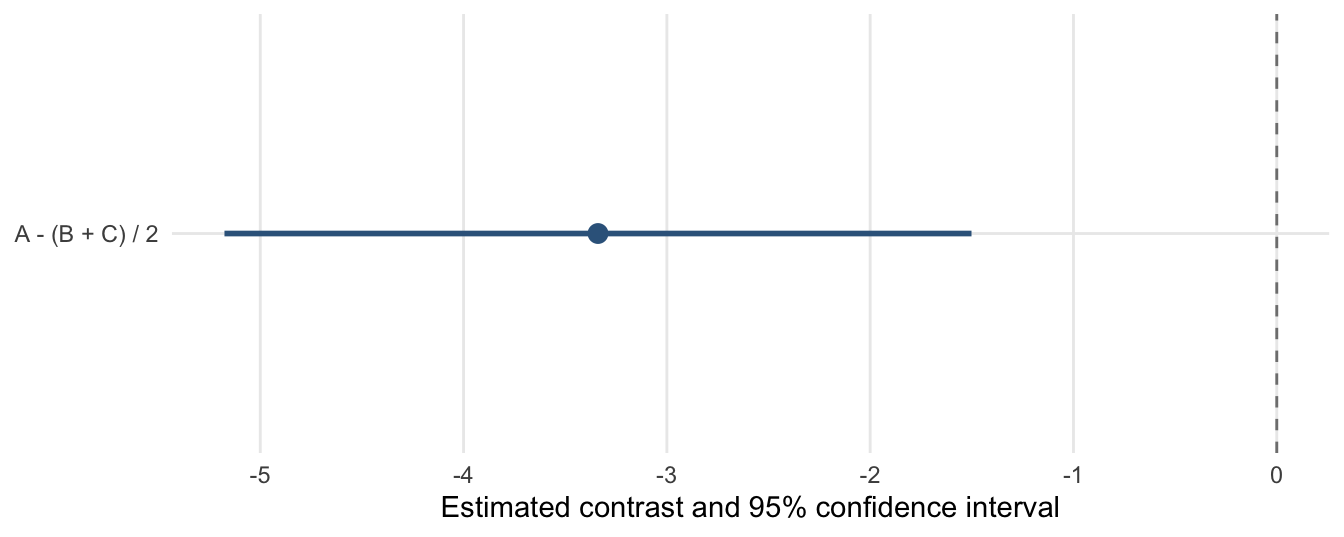
A family of comparisons. For all three pairwise group differences, fit the one-way ANOVA and request simultaneous Tukey intervals:
Show R code
TukeyHSD(aov(y ~ group, data = dat)) Tukey multiple comparisons of means
95% family-wise confidence level
Fit: aov(formula = y ~ group, data = dat)
$group
diff lwr upr p adj
B-A 2.8862540 0.3275576 5.444950 0.0242654
C-A 3.7914086 1.2327122 6.350105 0.0026175
C-B 0.9051546 -1.6535418 3.463851 0.6639004These intervals answer a different collection of questions from the single contrast above. Do not infer a difference between group means by inspecting whether two separate mean-response intervals overlap.
Practice
- Express \(\mu_B-\mu_C\) under treatment coding with A as reference, then under cell-means coding.
- Verify that the estimate and standard error agree under the two codings.
- Explain why the coefficients can change after changing the reference group while the scientific comparison remains unchanged.
- Specify the comparison family before reporting all pairwise differences, and explain the role of multiplicity adjustment.